

Cats are evolutionary masters at hiding pain, often concealing illness until it’s critical. However, the litter box reveals what they cannot. Changes in bathroom habits are the earliest warning signs for kidney disease, diabetes, and UTIs—often appearing weeks before physical symptoms.
This guide transforms your daily routine into a life-saving tool. Whether you choose a manual log or the automated, you’ll learn to establish a baseline, spot red flags, and catch silent killers early.
If you need to know the basics immediately, effective cat bathroom monitoring comes down to three core methods:
- Daily Visual Checks: A 30-second inspection of clump size and color while scooping.
- Weekly Data Logging: Recording frequency and volume in a notebook to spot trends.
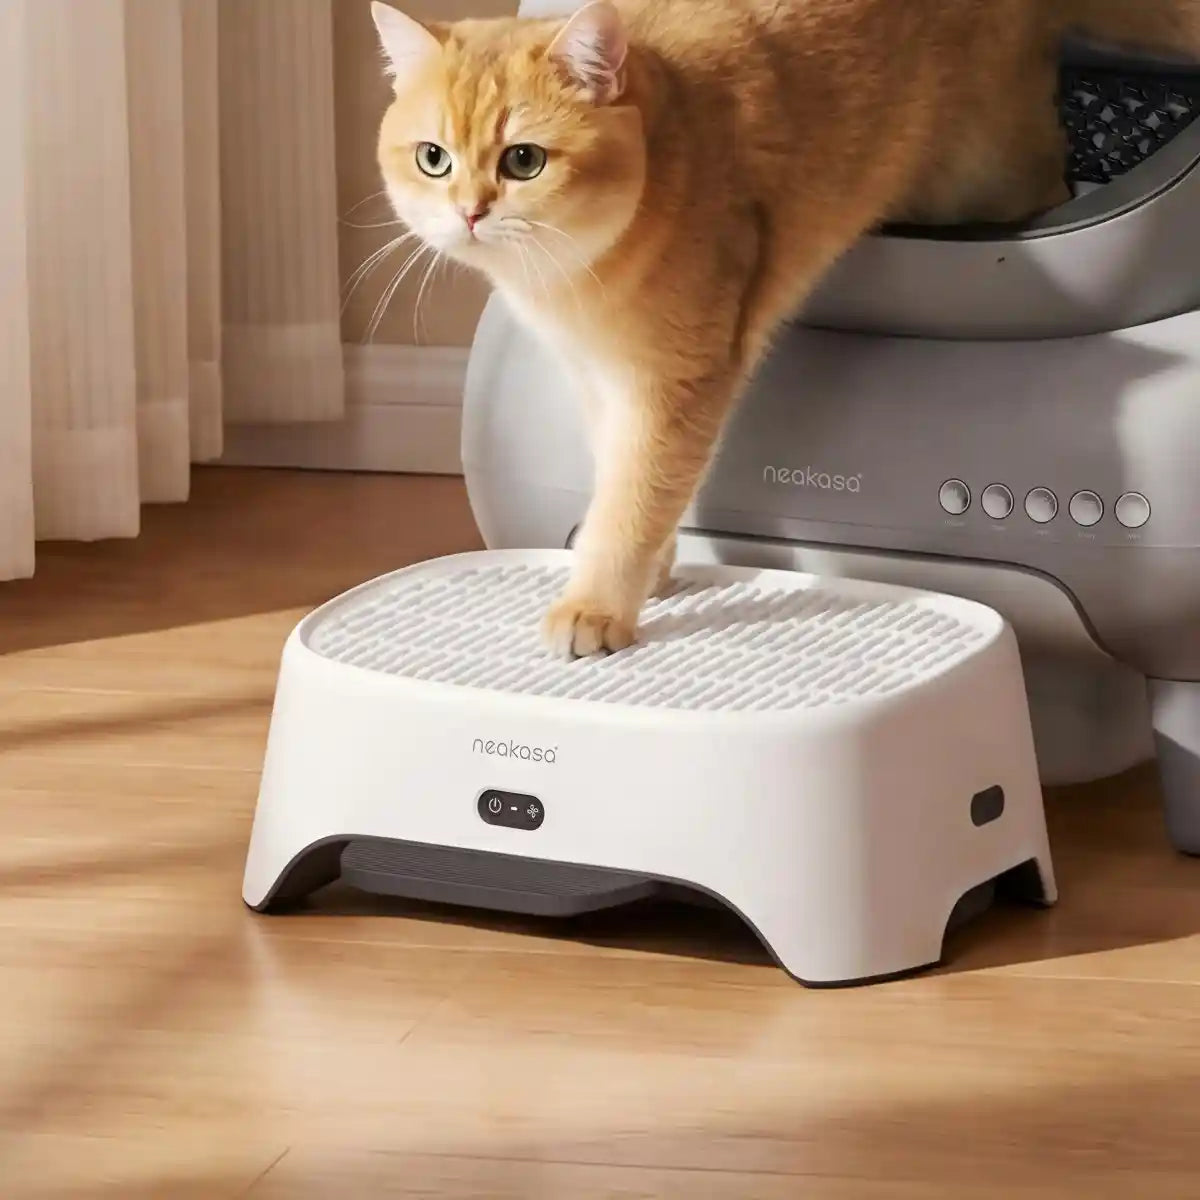
- Automated Tracking: Using smart litter boxes like the Neakasa M1 to automatically record visit duration and frequency.
Why it matters: Monitoring establishes a "baseline." If you know your cat typically urinates 2-3 times a day, a sudden jump to 6 times can indicate a Urinary Tract Infection (UTI) weeks before other symptoms appear.
Why Monitor? Detecting Kidney Disease & Diabetes Early
There isn't a "one size fits all" method for tracking. Your choice depends heavily on your schedule, your budget, and how many cats you own. Let's compare the three most effective strategies.
The "Health Detection Window"
| Disease | Detected via Monitoring | Detected via Symptoms | Potential Outcome |
|---|---|---|---|
| Kidney Disease | Stage 2 (Early) | Stage 3-4 (Advanced) | +2-3 years of life expectancy |
| Diabetes | Pre-symptomatic | Weight loss/Lethargy | High chance of dietary remission |
| UTI/Blockage | Day 1-2 | Day 5-7 | Prevents life-threatening rupture |
The Three Monitoring Approaches Compared
There isn't a "one size fits all" method for tracking. Your choice depends heavily on your schedule, your budget, and how many cats you own. Let's compare the three most effective strategies.
Approach #1: Visual Observation (The Basics)
Best for: Single healthy cats, budget-conscious owners.
This is the "old school" method. It involves a quick mental check while you are scooping the box daily.
- What to look for (30 seconds): Clump count, fecal deposits, visible blood, and odor intensity.
- Time Commitment: 3-5 minutes/day.
-
Effectiveness:
- ✅ Catches obvious changes (e.g., frequency doubling).
- ❌ Misses nighttime visits (when many UTIs flare up).
- ❌ Impossible to distinguish cats in multi-cat homes.
Approach #2: Manual Tracking Log (The Analyst)
Best for: Senior cats, cats with prior urinary issues.
For those who love data, a dedicated notebook or spreadsheet offers precision.
- What to record: Date, Time, Cat Name, Type (#1/#2), Volume, Appearance, Behavior.
- Time Commitment: 2-3 minutes recording daily + 5 minutes weekly review.
-
Effectiveness:
- ✅ Creates a historical baseline for objective comparison.
- ✅ Enables pattern recognition (e.g., "Worse in evenings").
- ❌ Requires high discipline to maintain daily.
Approach #3: Automated Tracking (Neakasa M1)
Best for: Multi-cat households, busy professionals, early detection.
Smart litter boxes like the Neakasa M1 handle the data collection for you using sensors.
- Neakasa M1 Features: Automatic visit recording, frequency tracking, weight-based ID (94-98% accuracy), and health alerts for frequency spikes (>50%).
- Time Commitment: 0 minutes daily (fully automatic).
-
Effectiveness:
- ✅ 100% visit capture (including 3 AM visits).
- ✅ Objective duration measurement (detects straining >3 mins).
- ✅ Per-cat tracking in multi-cat homes via weight ID.
Choosing Your Monitoring Approach
Not sure which method fits your lifestyle? We have combined the feature comparison with user profiles in the matrix below. Use this to compare costs, capabilities, and ideal use cases side-by-side.
Decision Matrix: Features, Costs & Ideal Users
| Factor | Visual Observation | Manual Tracking Log | Automated (Neakasa M1) |
| Cost | Free | Free | $$$ ($500-600) |
| Time Commitment | 3-5 min / day | 5-7 min / day | 0 min (Fully Automatic) |
| Nighttime Monitoring | No | No | Yes (24/7) |
| Multi-Cat Tracking | Hard / Guesswork | Difficult (Needs separate boxes) | ✅ Automatic (Weight ID) |
| Detection Speed | 2-3 days | 1-2 days | <1 day (Real-time alerts) |
| Data Accuracy | Variable (Memory-based) | ⚠️ Subjective (Observer bias) | Objective (Sensors) |
| Ideal For |
The "Budget-First" Owner
|
The "Analyst" Owner
|
The "Peace of Mind" Owner
|
Step-by-Step Guide to Manual Litter Box Tracking
If you choose the manual route, consistency is key. You cannot detect "abnormal" if you don't first understand what is "normal" for your specific cat.
Step 1: Establishing a 3-Day Baseline
Track everything for 3 full days to identify your cat's unique rhythm.
Sample Entry (Healthy Adult):
- 7:15 AM: Urination (#1) - Normal Volume - Pale Yellow - 45 sec duration.
- 2:30 PM: Defecation (#2) - Brown/Firm - 1.5 min duration.
- 7:45 PM: Urination (#1) - Normal Volume - 50 sec duration.
Step 2: Recognizing Patterns & Habits
By the end of the week, you should know your cat's "Normal":
- ✅ Normal daily visit count.
- ✅ Typical time of day (e.g., mostly post-meal).
- ✅ Duration baseline (typically <2 mins).
Step 3: Monthly Review & Log Maintenance
Ask yourself these questions once a week:
- Has frequency changed significantly? (e.g., 5+ visits vs usual 2-3)
- Is there any straining or pain signal?
- Has the odor changed (strong ammonia or sweet smell)?
Smart Health Monitoring with Neakasa M1
For those who want technology to do the heavy lifting, the Neakasa M1 offers a "set it and forget it" solution that monitors 24/7.
How to Set Up Neakasa M1 for Accurate Tracking
- Initial Setup: Install and calibrate. Weigh each cat (must differ by 2+ lbs for best accuracy).
- Daily Monitoring: Check the app once daily (2 mins). Look at the "Today's Visits" count.
- Understand the Alerts: The app sends notifications based on abnormal behavior.
Understanding Neakasa M1 App Alerts & Trends
The app sends notifications based on abnormal behavior. For example, a "Visit duration >5 min" alert could indicate a potential urinary obstruction, which requires immediate attention.
| Alert Type | What It Means | Recommended Action |
|---|---|---|
| Visit count +30% | Frequency slightly increased | Monitor for 2 days |
| Visit count +50% | Significant increase | Vet appointment (3-5 days) |
| Visit count +100% | Frequency doubled | Urgent Vet Visit |
| Duration >3 min | Possible straining | Monitor closely |
| Duration >5 min | Likely straining/Blockage | Contact Vet Same Day |
Interpreting the Data: Normal Baseline vs. Red Flags
Numbers mean nothing without context. Here is how to interpret the data you collect to decide if a vet visit is necessary.
What "Normal" Looks Like (Frequency, Volume, Duration)
- Daily Urinations: 2-3 times (Consistent)
- Daily Defecations: 1-2 times (Consistent)
- Duration: 30 seconds - 2 minutes
- Appearance: Clear/Pale yellow; Brown/Firm stool
Critical Red Flags: When to Call the Vet
| Change Observation | Duration of Symptom | Action Required |
|---|---|---|
| Frequency +30% | Persists 2-3 days | Vet appointment within week |
| Frequency +50%+ | Sustained | Urgent vet visit |
| Straining | Repeated episodes | Same-day appointment |
| Blood in Urine | Any presence | Same-day appointment |
| Sudden Color Change | Any instance | Vet appointment within 24 hrs |
How to Track Individual Cats in Multi-Cat Households
In a household with two or three cats, finding a concerning clump is a mystery. Who did it? This ambiguity is the biggest blind spot in traditional monitoring.
Solution 1: Manual (The N+1 Rule)
- Setup: 3 cats = 4 litter boxes.
- Challenge: You must train cats to use specific boxes (very difficult) or constantly watch them.
Solution 2: Automated (Neakasa M1 Weight ID)
- How it works: The system uses a weight-based algorithm. If Cat A is 12 lbs and Cat B is 8 lbs, the M1 distinguishes them automatically.
- Accuracy: 94-98% accuracy when weight difference is >1 lb.
- Benefit: Allows for individual health curves using a single shared box.
- Example: "Cat A: 5 visits (Abnormal)" vs "Cat B: 3 visits (Normal)."
Using Data to Communicate with Vet
Your vet is a detective, but they rely on your testimony to solve the case. Precise data turns a "guessing game" into a targeted diagnosis.
The Difference Data Makes
- ❌ Weak: "My cat seems to be using the litter box a lot lately."
- ✅ Strong: "My cat's frequency increased from 3 daily visits to 7-8 daily starting 3 days ago. The urine is cloudy. I have a 7-day log."
Essential Data to Provide
- Duration of change (e.g., "Started 2 days ago").
- Specific frequency numbers ("Usually 2, now 5").
- Context (Any diet changes or stress?).
Monitoring Guide by Age: Kittens, Adults, and Seniors
A kitten's bathroom habits look very different from a senior cat's. Adjust your monitoring expectations based on your cat's specific life stage to avoid unnecessary panic or missed warning signs.
| Life Stage | Normal Baseline | What to Watch For (Red Flags) |
|---|---|---|
|
Kittens |
5-7 visits daily |
1. Straining or crying |
|
Adults |
3-5 total visits daily |
Any deviation from established baseline |
|
Seniors |
Gradual increase |
1. Sudden frequency jumps (+30% sustained) |
Common Monitoring Mistakes
Even with the best intentions, owners can misinterpret data. Avoid these five common pitfalls to ensure your tracking is effective.
- ❌ Not Establishing a Baseline: Reacting to "high usage" without knowing what is normal for your cat.
- ❌ Reacting to Single Days: One day of high frequency could just be a hot day (more water intake). Look for 3+ day trends.
- ❌ Ignoring Hydration: If you switch to wet food, urination will naturally increase. This is healthy, not a disease.
- ❌ Ignoring Behavior: Noting "5 visits" but missing that the cat cried in pain during them. Behavior > Numbers.
- ❌ Not Sharing Data: Leaving your logbook or app history at home when visiting the vet.
Conclusion: Monitoring as Prevention
We often wish our pets could talk to tell us where it hurts. The truth is, they are talking to us—through their habits.
Cat bathroom monitoring is one of the highest-ROI health activities you can do. The 5-10 minutes weekly investment can catch kidney disease 2 years early or prevent a fatal blockage.
Your Monitoring Plan:
- Start Today: Establish a baseline over the next 7 days.
- Choose Your Method: Visual, Manual, or the Neakasa M1.
- Act: When you see a 3+ day sustained change, call your vet.
The Neakasa M1 eliminates the "monitoring burden" — all recording happens automatically, giving you peace of mind 24/7.


Leave a comment
This site is protected by hCaptcha and the hCaptcha Privacy Policy and Terms of Service apply.